
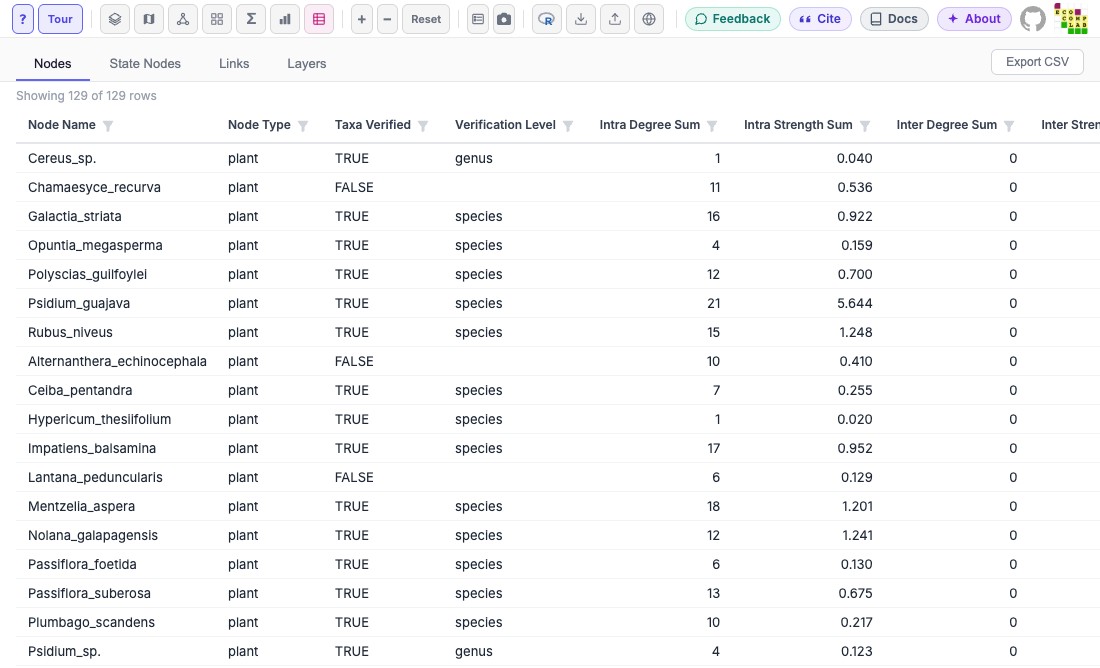
Opens the plot in MiRA's data mode: the network's tables (nodes, state
nodes, links, layers), with every attribute, sortable and filterable,
and Export CSV. A filter set there applies to network, grid and map
modes (its layers also to the layer view), like mira_filter() from R.
It opens on the nodes table with
every row; the other components of the plot do not apply (see
mira_mode). In MiRA, the data button (a table) opens this view.
See also
mira_filter() to filter from R; mira_mode for the other
views.
Other components:
mira_camera(),
mira_filter(),
mira_interlayer(),
mira_intralayer(),
mira_layer(),
mira_layout(),
mira_legends(),
mira_mode,
mira_mode_dashboard(),
mira_mode_grid(),
mira_mode_layer(),
mira_mode_map(),
mira_mode_meta(),
mira_node()
Examples
library(emln)
net <- load_emln(17)
#> Creating state node map
#> Creating extended link list with node IDs
mira(net, bipartite = TRUE, setA_type = "bird") + mira_mode_data()
#> Bipartite network: drawn as undirected. Use directed = TRUE for a directed one.
#> Not opened: R is not interactive. Print the plot in an R session, or give `browser` to open it from a script.