
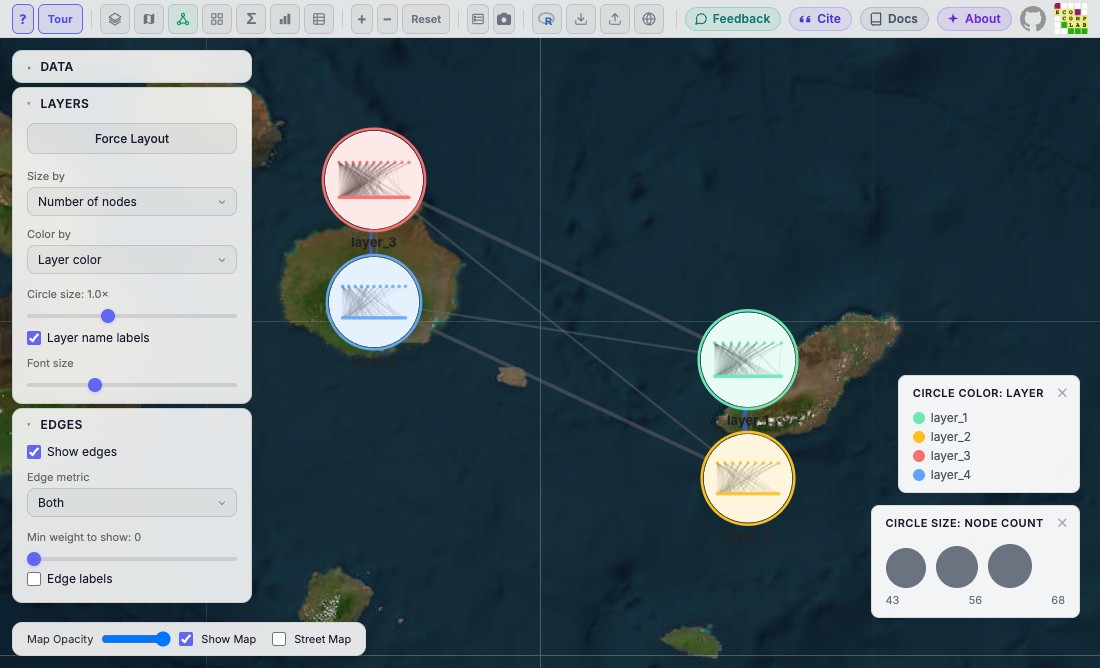
Opens the plot in MiRA's layer view: each layer is a bubble, with its
network drawn inside (positions from mira_layout()) and the layer's
color from mira_layer(); bubbles are linked by the nodes the layers
share and by interlayer links. When the layers have coordinates (latitude and longitude in
net$layers) the bubbles are placed on a map, fitted so that none is
under MiRA's panels; otherwise they are placed by a force layout. In
MiRA, the layer view button opens this view.
Details
Bubble colors follow mira_layer(color_by = ), one color per layer or a
layer column, with the same colors and legend as in network mode; in
MiRA, choosing a layer column in either view changes both. The layer
view's other settings (bubble size, colors by node count or edge
density, links between bubbles, labels) are not available from R yet;
it opens with MiRA's defaults. mira_filter(layers = ) applies: only the
layers it keeps are bubbles; its nodes and links do not (a bubble is
a whole layer).
A plot opens in one view: see mira_mode for the rules and for what applies in each view.
See also
mira_mode for the other views.
Other components:
mira_camera(),
mira_filter(),
mira_interlayer(),
mira_intralayer(),
mira_layer(),
mira_layout(),
mira_legends(),
mira_mode,
mira_mode_dashboard(),
mira_mode_data(),
mira_mode_grid(),
mira_mode_map(),
mira_mode_meta(),
mira_node()
Examples
library(emln)
net <- load_emln(17) # 4 layers on two islands: bubbles on the map
#> Creating state node map
#> Creating extended link list with node IDs
p <- mira(net, bipartite = TRUE, setA_type = "bird")
#> Bipartite network: drawn as undirected. Use directed = TRUE for a directed one.
p + mira_mode_layer()
#> Not opened: R is not interactive. Print the plot in an R session, or give `browser` to open it from a script.

# Bubbles in the layers' colors
p + mira_layer(color_by = "layer_name",
               color_values = c(layer_1 = "orange", layer_3 = "purple")) +
  mira_mode_layer()
#> Not opened: R is not interactive. Print the plot in an R session, or give `browser` to open it from a script.

# Bubbles colored by a layer column, as the layers are in network mode
p + mira_layer(color_by = "location") + mira_mode_layer()
#> Not opened: R is not interactive. Print the plot in an R session, or give `browser` to open it from a script.