
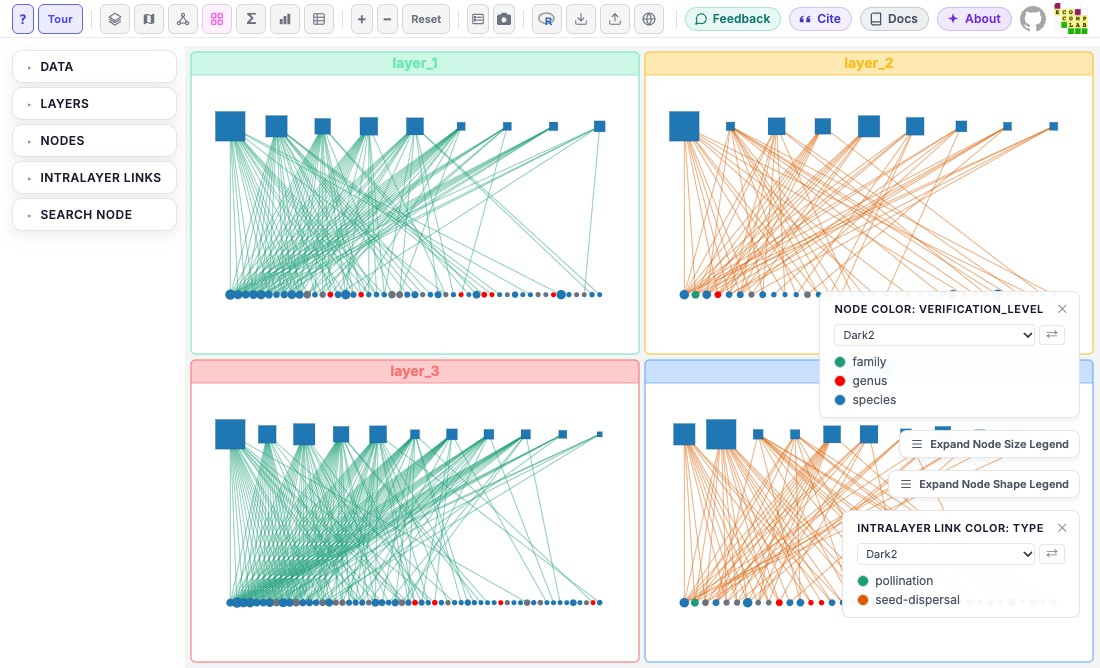
Opens the plot in MiRA's grid mode: one panel per layer, each with its
own nodes and links, as drawn in network mode (positions, colors, sizes,
shapes, layer colors, node names, the highlighted node). Interlayer
links are not drawn. mira_filter() applies: layers and nodes it drops
are not drawn, and the remaining layers fill the grid. In MiRA, the grid
button (four squares) opens this view.
See also
mira_mode for the other views.
Other components:
mira_camera(),
mira_filter(),
mira_interlayer(),
mira_intralayer(),
mira_layer(),
mira_layout(),
mira_legends(),
mira_mode,
mira_mode_dashboard(),
mira_mode_data(),
mira_mode_layer(),
mira_mode_map(),
mira_mode_meta(),
mira_node()
Examples
library(emln)
net <- load_emln(17) # 4 layers; bird and plant nodes
#> Creating state node map
#> Creating extended link list with node IDs
p <- mira(net, bipartite = TRUE, setA_type = "bird") +
  mira_node(color_by = "verification_level")
#> Bipartite network: drawn as undirected. Use directed = TRUE for a directed one.

# MiRA's default columns (here 2), then all layers in one row
p + mira_mode_grid()
#> Not opened: R is not interactive. Print the plot in an R session, or give `browser` to open it from a script.
p + mira_mode_grid(columns = 4)
#> Not opened: R is not interactive. Print the plot in an R session, or give `browser` to open it from a script.

# The filter applies in the grid
p + mira_filter(nodes = type == "plant" | node_name == "Geospiza_fortis") +
  mira_mode_grid()
#> Not opened: R is not interactive. Print the plot in an R session, or give `browser` to open it from a script.